

[vc_row][vc_column][vc_column_text]
The 3 most powerful visuals you will ever need to explain complicated data is either a pie, a bar or a line chart. According to Nancy Duarte, author of Datastory : Explain Data and Inspire action through story, she explained that the avalanche of data acquired is meaningless when we are unable to story tell the insights. She made these comments in the recent Paul Michelman podcast interview on “Every Number tells a story” on 12 November 2019. Nancy’s conclusion was based on observations derived from years of poring through mountains of presentations by top companies and brands around the world.
Storytelling has been the oldest form of communication technique since the dawn of mankind. Data, data, data means nothing when you are not able to articulate it. A storyteller is what you would need to capture interest, invoke desires and push for action.
When you begin to offer products and services in your website, please intentionally include these pie, line and bar charts to assist in communication especially if this is a vital piece of information required for shopping. While it may not apply to all industries or verticals, it is basic and yet easily overlooked. At the awareness funnel, you will be busy in just catching eyeballs. Once awareness has been unlocked through your touchpoints, the consideration funnel will require a lot more convincing. Explain it clearly in your product descriptions.
Apply descriptive statements for most part but do highlight key comparisons in charts when necessary. In my early article on B2B marketing, most B2B shoppers will be silently reviewing the various product specifications, comparing features and specifications, searching for reviews and recommendations. These silent desktops or rather mobile detectives will be probing all angles on your website. Make it easier, slap on a pie, a line or a bar chart to highlight your strengths.
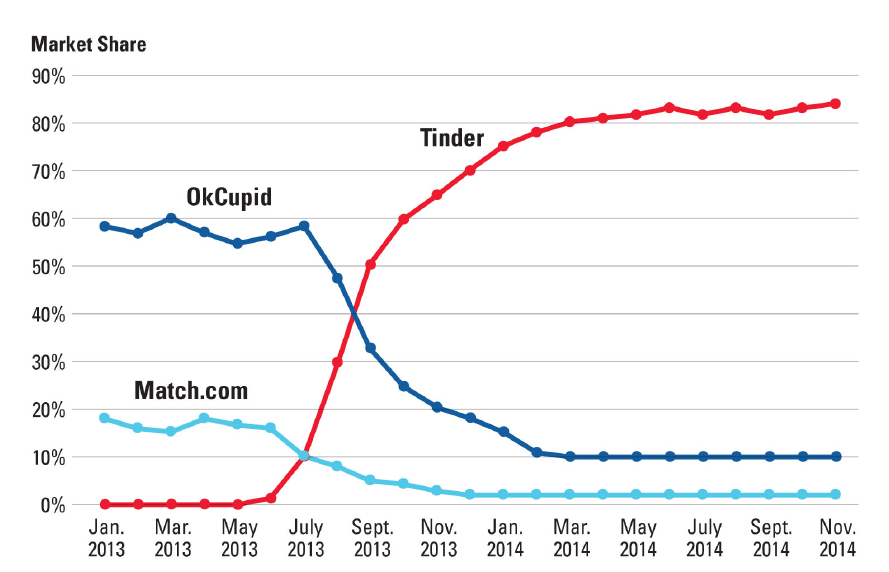
In the above line chart, the authors clearly demonstrated that the dating game was completely disrupted by Tinder. What was more evident was the chart shouted that the disruption only took 6 months to dethrone the incumbents in the dating applications in the USA. (Abolfathi & Santamaria, 2020)
What work here is that both Abolfathi & Santamaria (2020) successfully communicated that the dating scene applications were disrupted within 6 months of Tinder launch. This is largely due to their concept of gamification of Tinder’s user experience in contrast to Match.com and OkCupid of relying on algorithm to match dating profiles. This simple line chart captured my attention to dive deeper into their research and analysis of the dating business. It did the work of convincing me to read further. I will be writing on this in my future articles on business disruptions.
Back to storytelling, the 3 most powerful visual of storytelling, a pie, a line or a bar chart is a low hanging fruit with high hanging results. Use it, illustrate it and speak it. Turn your complicated data into meaningful interpretations. Delight your audience, provide them a moment to stop and to listen in.
[/vc_column_text][/vc_column][/vc_row][vc_row][vc_column][vc_column_text]
References
Abolfathi, N. & Santamaria, S., 2020. MIT Sloan Management Review : Dating Disruptions – How Tinder Gamified an Industry. [Online]
Available at: https://sloanreview.mit.edu/article/dating-disruption-how-tinder-gamified-an-industry/
[Accessed 13 Feb 2020].
Michelman, P., 2019. MIT Sloan Management Review. [Online]
Available at: https://sloanreview.mit.edu/audio/every-number-tells-a-story/
[Accessed 2 Feb 2020]
[/vc_column_text][/vc_column][/vc_row][vc_row equal_height=”yes” content_placement=”middle”][vc_column width=”1/6″ offset=”vc_hidden-xs”][vc_single_image image=”1715″ style=”vc_box_outline_circle”][/vc_column][vc_column width=”5/6″ offset=”vc_hidden-xs”][vc_column_text]
author
Doh Hau Goh
Goh Doh Hau is in the leadership team of Garganto, a boutique style digital marketing agency and ecommerce builder. He enjoys marrying evidence-based research with observation insights to curate gems of practical information. He is a MBA graduate from Sydney Business School (University of Wollongong)[/vc_column_text][/vc_column][/vc_row][vc_row equal_height=”yes” content_placement=”middle”][vc_column width=”1/6″ offset=”vc_hidden-lg vc_hidden-md vc_hidden-sm”][vc_single_image image=”1715″ alignment=”center” style=”vc_box_outline_circle”][/vc_column][vc_column width=”5/6″ offset=”vc_hidden-lg vc_hidden-md vc_hidden-sm”][vc_column_text]
author
Doh Hau Goh
Goh Doh Hau is in the leadership team of Garganto, a boutique style digital marketing agency and ecommerce builder. He enjoys marrying evidence-based research with observation insights to curate gems of practical information. He is a MBA graduate from Sydney Business School (University of Wollongong)[/vc_column_text][/vc_column][/vc_row]